October 2025 Insights from Actor
I’m a data guy, love to play with numbers, so here’s our first overview of user accounts at Actor.
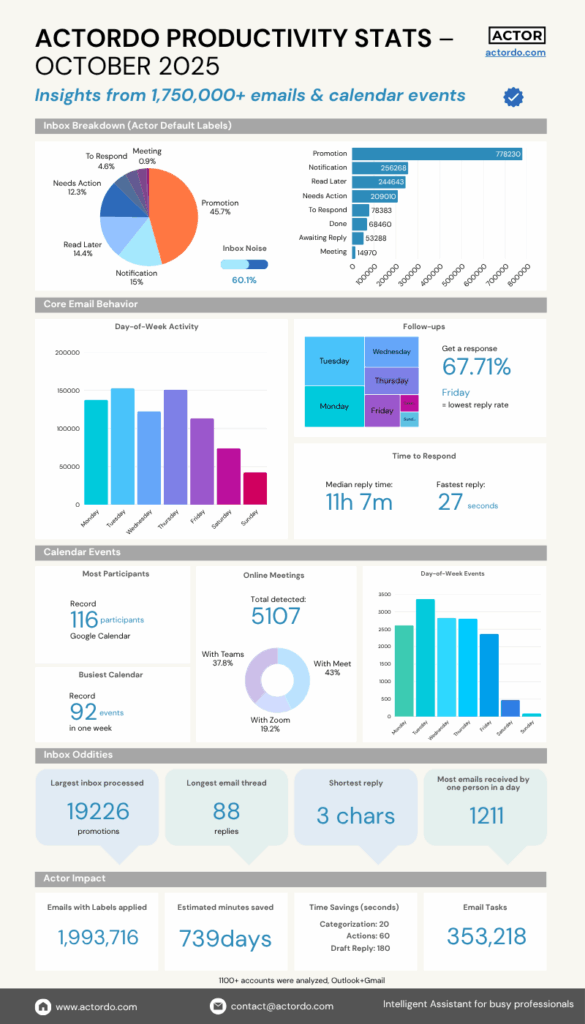
We analyzed over 1.75 million emails and calendar events from professionals using Actor, AI assistant for inbox & calendar management.
Some insights surprised us:
- 📨 60% of inboxes are “noise” (promotions + notifications)
- ⏱️ Median reply time: 11h 7m, but fastest was 27 seconds
- 🗓️ Friday has the lowest reply rate
- 💬 Longest email thread: 88 replies
- 📅 Some people joined 92 meetings in a week! (actually not sure if they joined or just skipped)
We built this to understand how real users manage communication overload.
Would love to hear: what’s your biggest time drain — emails or meetings?
Insights from 1,750,000+ emails and calendar events
Monthly workplace Productivity Trends from real professionals
Every month at Actor, we analyze aggregated and anonymized activity from thousands of connected Gmail and Outlook accounts to understand how busy professionals actually work.
Today we’re releasing the October 2025 Productivity Report, covering 1.75M+ emails, replies, follow-ups, and calendar events.
Why do we publish this?
Because professionals, journalists, and content creators consistently search for answers to questions like:
- How much email noise do people receive today?
- What’s a normal reply time at work?
- Do people really have too many meetings—or is it just a feeling?
- Which day of the week gets the most email traffic?
- When are people most likely to respond?
- What does “email overload” actually look like in numbers?
This report gives data-backed answers, not speculation.
Below are the most notable patterns from the October dataset.
Inbox Noise is higher than never 60.1% of all emails
Nearly two-thirds of inbox volume comes from Promotions (45.7%) and Notifications (15%).
This means the average professional’s inbox is dominated by messages that aren’t actionable and don’t require any decision-making.
For teams overwhelmed by communication, this highlights a simple truth: the inbox is not the problem—noise is.
Wednesdays and Thursdays are the busiest email days
Consistent with previous months, email volume peaks mid-week:
- Wednesday is the most active day
- Monday, Tuesday, and Thursday follow closely
- Friday shows a visible drop
- Weekends remain comparatively quiet
This pattern matters for journalists and creators building content around work culture and productivity cycles.
Follow-Up behavior: Tuesdays & Wednesdays perform best
If you ever wondered when you’re most likely to get a response, the data is clear:
- Overall reply probability: 67.71%
- Best days to send follow-ups: Tuesday and Wednesday
- Worst day: Friday (no surprise there)
Professionals planning sales outreach, hiring emails, PR pitches, or customer success follow-ups can use this as a benchmark.
Reply time benchmarks: Median = 11h 7m
This is one of the most searched questions online:
“What is a normal reply time at work?”
In October:
- Median reply time: 11 hours, 7 minutes
- Fastest reply: 27 seconds
This range reflects the reality of modern work: people are responsive, but not instantly.
It also suggests that expectations of “instant replies” are unrealistic.
Meetings are Increasing .5107 Online Meetings detected
Online meeting volume remains high:
- Google Meet: 43% of meetings
- Microsoft Teams: 38%
- Zoom: 19%
The busiest calendar recorded 92 events in a single week, showing how extreme some workloads are.
Inbox oddities worth noting
These insights are designed for journalists and creators looking for unusual workplace behavior data points:
- Largest inbox processed: 19,226 promotions
- Longest email thread: 88 replies
- Most emails received by one person in a day: 1211
These extremes often make compelling story hooks for coverage about burnout, hyper-connectivity, or modern communication norms.
Impact: 739 Days of Time Saved
Across all Actor users in October:
- 1,993,716 emails were automatically categorized
- 353,218 email tasks were extracted and surfaced
- Estimated time saved: 739 human days
- Draft replies and suggested actions significantly reduced cognitive load
For teams that struggle to keep up with email volume, these numbers show the real impact automation can have.
Notes after publishing
After publishing this infographic, we realized a few key aspects that are worth mentioning:
- junk / archive / trash folders on both gmail and outlook are completely ignored
- some users have configurations that actually move emails directly to those folders, and they should be still considered Promotion (most probably)
This is first version of our aggregated anonymous data statistic. We plan to have those created monthly and we’ll try to improve them.
If you have ideas or things you think are worth to be added to such statistic, let me know here or by email.