Email Analytics: The Complete Guide to Understanding Your Inbox (Gmail & Outlook)

Most professionals spend 2–4 hours per day in email, yet almost nobody measures how email actually affects their work.
Email Analytics is not only for marketers who look for open rate, click rate and unsubscribe rate. Email Analytics is for every digital professional living in their inbox.
Unlike marketing teams that track campaigns, individuals rarely understand:
- how much email they receive
- how fast they reply
- how much work email creates
- how much time their inbox consumes
Email analytics helps turn your inbox from constant noise into measurable work patterns.
In this guide you’ll learn:
- what email analytics is
- what metrics matter for individuals
- how to measure them in Gmail and Outlook
- what insights actually improve productivity
This is different from marketing email analytics, which tracks open rates, clicks, and campaigns. Personal Inbox Analytics focuses on how email affects your productivity.
Why professionals need email analytics?
Without analytics, email feels chaotic. But once measured, clear patterns appear.
For example:
- a few people generate most of your inbox traffic (both received and sent)
- most emails arrive during specific hours
- reply time changes depending on sender
- many conversations turn into long threads
If you know your Email analytics you can:
- improve response expectations
- understand inbox workload
- reduce response stress
- detect communication bottlenecks
- manage follow-ups
The 10 Most Important Email Analytics Metrics
Introduce the list and link to the other articles.
1. Email Volume
How many emails you receive and send.
👉 Read more: Email Load Metrics
2. Email Response Time
How fast you typically reply.
👉 Read more: How Fast Should You Reply to Emails
3. Conversation Depth
How many messages each thread contains.
👉 Read more: Email Thread Analytics
4. Email Workload
How many emails create tasks or requests.
👉 Read more: Measuring Email Workload
5. Inbox Health
Unread messages, pending replies, backlog.
👉 Read more: Inbox Health Metrics
6. Follow-Up Analytics
Emails waiting for replies and follow-ups.
👉 Read more: Follow-Up Email Analytics
7. Time Spent in Email
Estimated time reading and writing emails.
👉 Read more: How Much Time You Spend in Email
8. People Analytics
Top contacts and communication intensity.
👉 Read more: Email Relationship Analytics
9. Work Hour Patterns
Emails sent outside work hours.
👉 Read more: Email Timing Analytics
10. Email Productivity Insights
AI conclusions about your email habits.
👉 Read more: Inbox Productivity Analytics
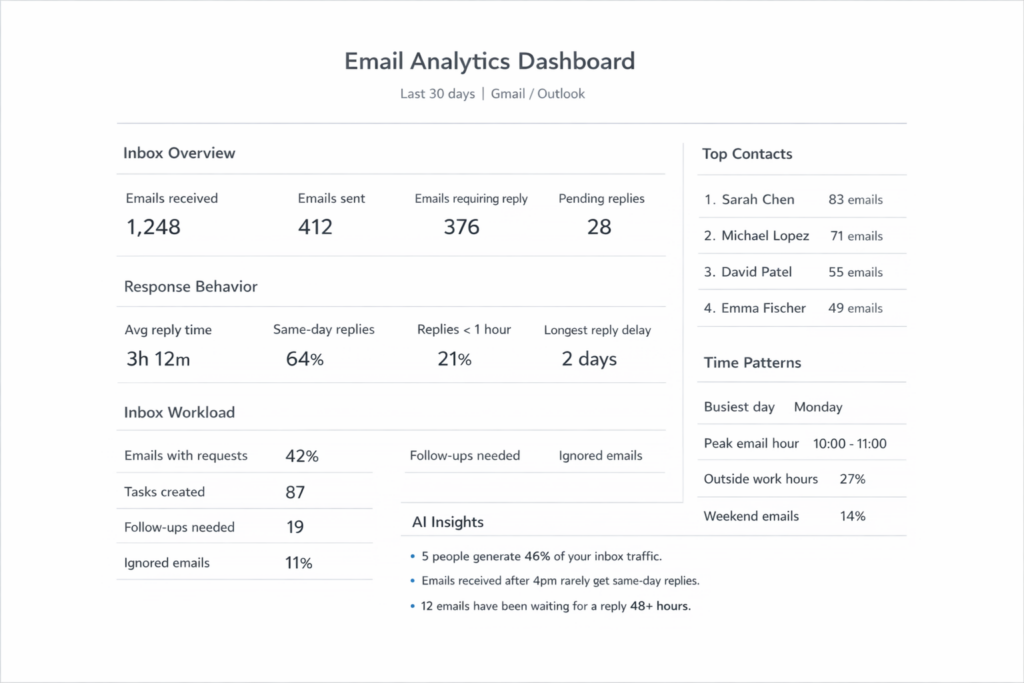
What an ideal Email Analytics Dashboard looks like
An ideal email analytics dashboard gives you a clear, simple view of how email affects your work.
Instead of just counting messages, it highlights key insights such as inbox volume, response times, pending replies, follow-ups, and the people generating most of your email traffic. So you can quickly understand where your attention is going.
How AI is changing Email Analytics:
AI allows deeper insights:
- detect requests automatically
- estimate workload from emails
- detect conversations requiring follow-ups
- summarize communication patterns
Instead of charts, AI can explain:
“Three contacts generate 42% of your email workload.”
How to start tracking your email analytics?
You can do manual tracking, use email statistics tools or tools like Actor Email Assistant that analyze your entire inbox activity.
Don’t forget, what you don’t track you can’t improve, that’s why numbers about your inbox statistics are important.